Tracking performance is essential to improve your digital consultations and marketing strategies. With myArbrea Analytics inside Arbrea Suite, you gain access to valuable data that helps you understand user engagement, lead behavior, and content performance.
This guide walks you through the steps to easily check your analytics.
Open Arbrea Suite #
Begin by launching the Arbrea Suite app on your iPad. Make sure you’re connected to the internet to access myArbrea features.
Click on the myArbrea Tab #
From the main dashboard, tap the myArbrea button to enter the integrated interface that connects your Arbrea tools with myArbrea services.

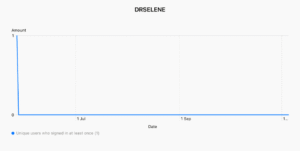
Go to the Analytics Tab #
Navigate to the Analytics tab within myArbrea. This section provides a visual and data-driven overview of how your page and shared content are performing.
Check the Data Available to You #
Review key metrics such as:
- Number of visitors to your myArbrea page
- Interaction and click-through rates
- Simulation views and shares
- Contact form submissions
Use this data to optimize your content, marketing efforts, and patient communication strategy.
Conclusion #
myArbrea Analytics empowers you to make data-informed decisions that enhance your marketing impact and patient engagement. By regularly reviewing these insights, you can refine your strategy, tailor your content, and ultimately convert more leads into consultations. Start using your analytics today to grow your practice with confidence and precision.
